Source: RBA
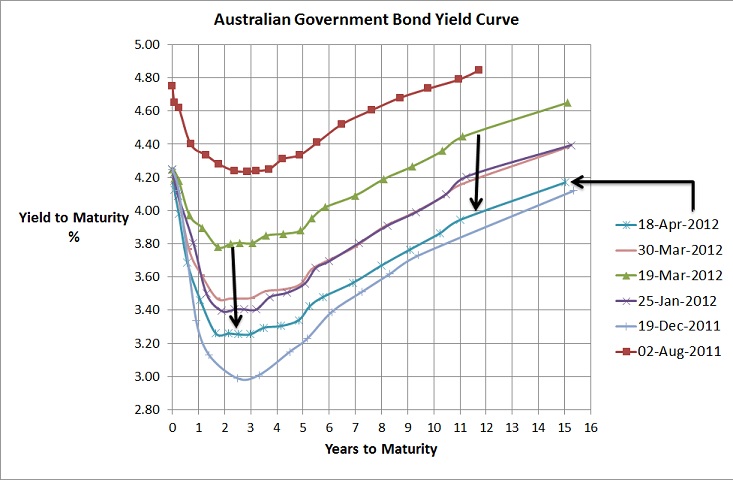
The above chart shows that bond yields shows that after bond yields reached a high around 1 month ago they have declined across all terms by around 50bps. That means that most of the traditional bond funds would have produced capital gains of around 2% over that last month (because the duration od the bond index is a little short of 4 and you multiply that by the yield curve change to get the approximate capital gain/loss)…definitely an excellent month for bond funds. The downside is that the yield curve has dropped because the economic outlook, once again, has taken a turn for the worst. Europe is starting to blow up again…Spanish 10 year bond yields have been hovering around 6% thanks to a nasty austerity package…and there’s also been some lower than expected Chinese GDP data (not that anyone’s every believed the numbers anyway) which has contributed to lower commodity prices.
These continue to be the two big issues for our economy, bond and equity markets; so what the future holds is anyone’s guess but as I’ve been blogging for a long long time, I’m very confident that markets will be volatile…oh yeah and the market is pretty confident cash interest rates are coming down and at least 50bps this year.
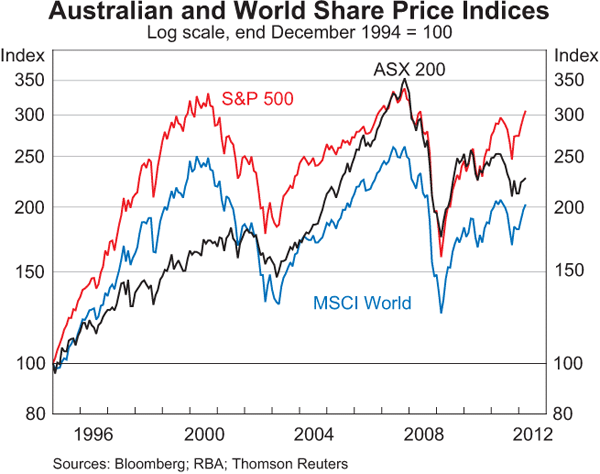
Now whilst I’ve just mentioned that China and Europe are likely the biggest impacts on our markets…as the below correlated chart shows…the direction in our market is unlikely to be too different to anyone elses.


