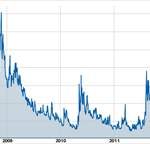
Source: Mornngstar Direct, Delta Research & Advisory The above chart shows distributions of excess monthly returns over the UBS Bank Bill index from July 2000 to November 2012 for four different indexes that more or less represent the different strategies a bond portfolio can accept… Citi AusBiig 1-3 Yr index … representing short duration Citi …
Tag Archive: Interest Rates
Nov 15
Australian Government Bond Yield Curve…certainly not going up
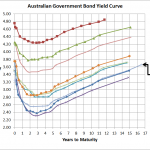
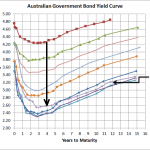
Source: RBA I’ve uploaded the above chart in preparation for a presentation I’m giving tomorrow on portfolio construction. Anyway, the message isn’t really a great deal different from previous posts commenting on the Government bond yield curve. Namely, Interest rates are very low…you should be able to get some nice low fixed interest rates for …
Oct 22
Australian Government Bond Yield Curve…still struggling
Source: RBA & Delta Research & Advisory I can’t believe how time is flying and it is more than a month since I posted my last bond yield curve. The Mid Year Economic & Fiscal Outlook released today has provided numbers supporting a further slowdown in government revenue and this economic weakness has certainly been …
Oct 10
Impact of the rate cut on house prices
I am a little amazed at how many articles across the newspapers of Australia have suggested that residential house prices are going to go through the roof given the latest interest rate reduction from the RBA. The chart below shows that house prices have declined over the last couple of years or so, but somehow its …
Oct 05
Outlook for Bond Returns…
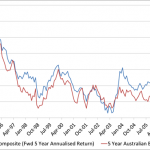
Source: Delta Research & Advisory, RBA, Morningstar Direct The above chart shows the forward 5 year annualised return of the UBS Composite Index and the 5 year Australian Government Bond index. The last data point in the chart is Septembr 2007 meaning the forward 5 year return is the annualised return of the UBS Composite …
Sep 18
Australian Government Bond Yield Curve…no change???
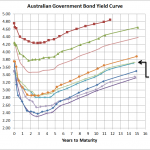
Source: RBA, Delta Research & Advisory Bizaarely as it seems but the above chart shows that over the last month the Australian Government Bond Yield curve has barely budged. There’s really no more than 5 to 10 bps difference across all terms and when you consider the various big announcements, economic results from here, overseas …
Aug 20
Australian Government Bond Yield Curve…continued improvement
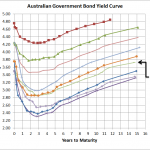
Source: RBA With equity markets improving over the past few weeks, so too have Australian Government Bond yields increased. 10 Year yields were below 3% a couple of months ago and now they are hovering near 3.5%. For Australian bond fund owners that should be a capital loss of close to 2% since mid-June. Nevetheless …
Aug 11
Investment Perspectives
Its been a while since I put some of my broader investment thoughts in writing and I’ve just written almost 4000 words to satisfy that…so it also sort of makes up for my lack of posting. So below is a lot of what I have written and hopefully its readable for anyone interested…I actually haven’t …
Aug 02
Australian Government Bond Yield Curve…slight increase but risks remain
Source:RBA The above chart shows that over the last few weeks there has been an increase of around 10-25bps across the yield curve which is also in line with the marginally stronger equity markets. As I’ve stated numerous times before, the European situation is what is currently driving most major market moves and the partial …
Jun 19
Australian Government Bond Yields…a little lower still this month
Source: Reserve Bank, Bloomberg I’ve placed this chart on my website more as a reference for an upcoming presentation I’m giving than for any real message it conveys. Basically not too much change…yields are slightly lower than they were at the end of May but they increased a little from a couple of weeks ago …


