Its been a while since I put some of my broader investment thoughts in writing and I’ve just written almost 4000 words to satisfy that…so it also sort of makes up for my lack of posting. So below is a lot of what I have written and hopefully its readable for anyone interested…I actually haven’t read it, I’ve just written it. Anyway, my thoughts are divided into asset classes and I know there’s a lot to read if interested otherwise you can open a PDF here…oh yeah, Delta Research & Advisory is my new consulting company if you think I’m steeling the PDF document from another company!
Whilst writing this my mind tended to wander so there may be some inconsistencies from section to section and I know some of the arguments may be read as insufficient or flawed but, oh well, that’s the way it goes i didn’t really feel like writing 10,000 words.
Background
The economic environment continues to be relative fragile despite European woes calming somewhat. The China slowdown continues as weaker economic data continues to flow and in the US, mixed economic results continue and should continue through to the election at which point the next term’s president will need to deal with the “Fiscal Cliff” which will be a 3-4% hit to US GDP should it go ahead.
Overall the global economy, like during the great depression, is currently undergoing a massive deleveraging. The debt of the private sector is shifting to the public sector and it has revealed the flaws in the European Monetary Union. The deleveraging process has many years to play out and so too does the resolution of the European situation where it is widely accepted that Greek will exit with the strong potential of others to follow.
This economic backdrop may continue to present shocks to equity markets and keep uncertainty high resulting in high equity market volatility and low bond yields for highly rated sovereigns (US, Germany, UK, Australia, Switzerland) for many years to come.
Cash
The Reserve Bank held fire on cash rates at the start of August and with decent unemployment figures (5.2%) announced this week, whilst Europe doesn’t get too much worse, cash rates are likely to stay the same. At 3.5%, the Reserve Bank’s yield is much higher than longer term bond yields.
Short duration term deposits (< 1 year) continue to be very attractive as Australian banks continue to fund their future needs from local investors given European debt concerns effectively shuts down that market. It is possible to get 5.3% for a 1 year term deposit and this represents a premium of more than 220bps over 1 year government debt. When you consider the equity risk premium over the last 50 years in the Australian market has only been around 300bps over government bonds that is an attractive offer for a government guaranteed investment.
Fixed Interest
Australian
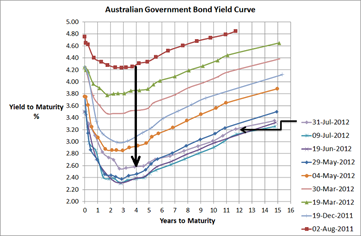
The last month has seen Australian Government bond yields increase by around 40bps or more and 4 year bonds are now yielding around 2.8%. This yield is significantly below the RBA cash rate and the negative shape of the yield curve out to 3-4 years reflects the market’s view of economic troubles ahead for Australia. With a yield this low, conservative boring government bonds are certainly unattractive for long term investors but they have proven to have the lowest correlation with sharemarket volatility in these economic times so its difficult to ignore them in a diversified portfolio.
Once again, the real value for longer maturities (> 1 year) comes in the way of term deposits. Today it is possible to receive 5.5% for 2 years or 5 years; whilst 5.25% is possible for 4 years and this represents a premium of 245 basis points over Australian Government bonds and is therefore very attractive and much better value than pure government bonds given the government guarantee is still in place for amounts less than $250K.
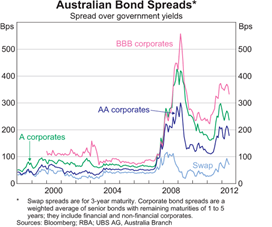
Accepting more credit risk currently appears to have potential. In recent weeks, Westpac announced an Unsecured Subordinated Notes issues whereby it promises to pay 2.75% over the 90 day BBSW rate each quarter. With 90 day BBSW currently around 3.6%, this represents a floating interest rate of 6.35%pa. which is significantly higher than term deposit rates and paid by a “Big 4”, “too big to fail” bank. Despite these being lowly ranked in the capital structure, it is difficult not to be tempted. Other listed hybrids in the market are also paying significant premiums over government bonds. With bond spreads still historically relatively high (refer Chart 1), accepting credit risk does appear to be reasonable value in the so-called stronger economy of Australia. If accepting this strategy, diversification is key, but also keep in mind that credit spreads provide less protection when equity markets fall so be prepared for volatility of return and to hang in there for the long term.
Chart 1
Source: RBA
Global
With bond yields at historic lows for all major sovereigns (who have their own currency…and this assumes Germany owns the Euro) such as US, Japan, Switzerland, and UK; its difficult to see any long term value. But once again, the boring low risk Global bond fund shows that it is the true diversifier to significant equity market volatility. Over the last 12 months Global Bond indices have return between 10% and12%, despite yields already being so low that many commentators suggested there was no value one year ago either.
So like Australian Government Bonds, a diversified boring Global Bond fund should play a part of a diversified portfolio to cushion equity market volatility (assuming this is of concern).
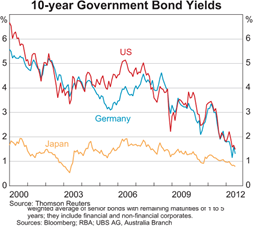
A second advantage of Global Fixed Interest continue to be the carry when hedge back to Australian dollars. Because RBA cash rates are 3.5% and Global sovereign cash rates are near 0; this means there is an additional ~3.5% added to the global bond yield. Whilst, 5 year bond yields across major economies are no more than 1%, then this currently produces a 4.5% yield when hedge back to Australian dollars and this is a little higher than Australian government bond yields. Of course, if the RBA continues to reduce its rates then this carry will reduce along with it and when rates do ultimately turn (and this may take years), then the downside potential is quite large.
Chart 2
Source: RBA
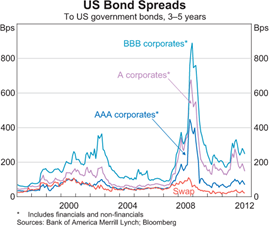
Once again, despite being a poor diversifier with equity markets, the reasonable value in Global Fixed Interest appears to be in credit markets. Obviously with weaker economies in the US and Europe, you should receive a higher premium but as chart 3 shows, premiums in the US are still near levels seen near the height of the tech wreck.
Chart 3
Source: RBA
In the US, equity risk premiums over the last 100 years have only averaged around 300bps so with similar premiums offered by BBB corporates, that appears to be reasonable value compared to equities for a well-diversified portfolio of credit securities.
Property
Australian
A-REITs continue to trade below Net Asset Values however the exceptions are the management companies such Westfield Group. Despite this apparent value potential it is interesting to note that for the top 10, Real Estate companies on the ASX, the independent broker research house Morningstar, has a rating of HOLD or REDUCE on each one. Certainly Morningstar doesn’t see value in this sector.
Australian residential property prices have been declining over the last 12 to 18 months and with a negative bond yield curve (Chart 4) suggesting an economy getting weaker, perhaps there’s expectation that book prices of the listed properties will be declining.
Either way, despite recent good performance, listed property has proven to be a poor diversifier and poor performer over the last 10 years relative to Australian equities and whilst this sector should continue to pay higher dividends than the broader sharemarket it is difficult to understand whether the additional concentration risk this sector has is worth it.
Given Westfield and Stockland make up 50% of the Australian listed property market the success of a fund manager will depend on their decisions on these two stocks…indexing makes most sense…and it is difficult to suggest an overweight position for this over rated sector.
Chart 4
Source: RBA and www.fureyous.com.au
Global
Investing in Global Property Securities funds in Australia has not been around many years but for those who have invested in anything but Index funds, it has been a frustrating experience. There are around 20 funds that have 5 year track record to the end of July 2012 and only 2 have managed to outperform the Hedged Vanguard International Property Securities fund (BT & UBS). Over the last 3 years only the geared CFS Global Property Securities fund has managed to outperform the Vanguard fund (but is at the bottom of the pile over 5 yers). Paying for active management in a sector that many researchers believe is inefficient has hardly worked at all.
Anyway, there’s little doubt global property securities have had an excellent run of returns over the last 3 years whereby the index returned around 25%pa. Over 2007 and 2008, this asset class dropped more than 60% so the 25% per annum doesn’t appear so bad. However, once again what it does show is that as an asset class there are significant question marks around its validity. These highly volatile returns don’t resemble the inflation hedging consistent income investors wish to receive from property securities funds. Instead they have received scarier than equity like returns and once again its difficult to mount an argument to overweight this asset class relative to the more diversified global equities.
Equities
Australian
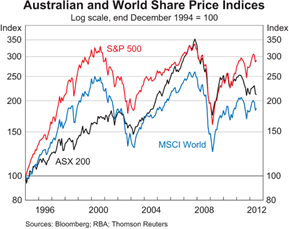
Chart 5 shows that when it comes to diversification the Australian sharemarket has provided little to no shelter from the major global sharemarkets. Increases in the Australian market are likely to coincide with increases in global sharemarkets and vice versa. Chart 5 also shows how the Australian sharemarket has more recently underperformed the S&P500, despite Australia having a much stronger economy than the US…this is simple evidence supporting the relatively weak correlation between economic performance and sharemarket performance.
Chart 5
Source: RBA
So does this price diversion mean that there is potential for the Australian sharemarket? I guess before answering that, we need to understand what the main drivers of the Australian sharemarket are. Unfortunately, the Australian sharemarket is quite concentrated and comprises roughly one-third resource stocks (actually 28%), one-third financial services (actually 42%); and one-third that is somewhat a mixed bag (30%). Compared to global sharemarkets, the Australian market has very little technology (<1% vs 10%), healthcare (3.75% vs 10%), or consumer discretionary (<3% vs 11%).
As a result with the large resources sector it has been very exposed to the slowdown in China and the 2012 sell off in Commodities plus the European woes have had a negative impact on our financial services sector…refer Chart 6.
Chart 6
Source: Morningstar Direct
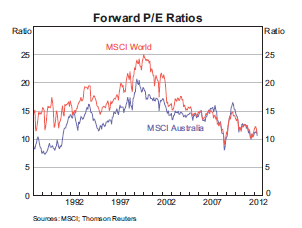
In terms of valuations, our sharemarket appears historically cheap on a PE basis…refer Chart 7…and this has been a consistent story from many fund managers. The major risk with this simplistic valuation analysis is that earnings forecasts have also been in decline (refer Chart 8) so if the price declines at the same rate as the earnings decline then there is no change in PE…but the outcome for investors is obviously poor.
Chart 7
Source: RBA
With the slowdown in China and the rest of the world the big question will be, will Australian company earnings expectations continue to decline. If so, then so too will prices and it won’t be a good results for sharemarket investors.
Whilst it is very difficult to predict the direction of sharemarkets, it does appear that they will continue to be volatile and experience external shocks from the macroeconomic issues in Europe, China and the USA. The success or failure of these economic scenarios will be the true drivers of Australian sharemarket returns and it is impossible to know what the outcomes will be.
Chart 8
Source: RBA
Longer term, the PE has been a reasonable indicator of long run return potential ad Chart 7 does indicate that both the Australian and global sharemarkets have significant upside potential…its just when that potential will be realised is the big challenge.
Whilst the Australian sharemarket is relatively concentrated, it does offer Australian investors around a 1% additional gross return from franking credits that are not available to overseas investors.
Global
The issues affecting global sharemarkets are pretty much the same as Australian sharemarkets. The European situation will be a large driver as will the slowdown in China and the ultimate outcome of the US Fiscal Cliff.
As mentioned before, the main advantage of global sharemarkets is the fact they are diversified across many sectors that are not widely available in Australia. Fundamentally, investing overseas isn’t really much more than a diversification play. That is, diversification across currencies, economies, industries, sectors, and a variety of other risks. Don’t forget, diversification is the only free lunch in finance and whilst over the last 100 years the Australian sharemarket has pretty much outperformed all others, we certainly don’t know if that will continue.
To demonstrate the different sector exposures, Tables 1 to 3 show the differences in Sectors between MSCI Australia, MSCI EAFE, and S&P 500…please note that combining S&P500 and MSCI EAFE is similar to MSCI World Index.
Table 1
| Sector |
MSCI Australia |
MSCI EAFE |
S&P500 |
| Financials |
41.9% |
22.4% |
14.4% |
| Materials |
22.0% |
9.5% |
3.4% |
| Consumer Staples |
8.4% |
11.7% |
11.3% |
| Industrials |
6.8% |
12.4% |
10.4% |
| Energy |
6.2% |
8.3% |
10.8% |
| Telecommunications |
4.9% |
5.6% |
3.2% |
| HealthCare |
4.0% |
10.0% |
12.0% |
| Consumer Discretionary |
3.1% |
10.5% |
10.9% |
| Utilities |
2.0% |
4.3% |
3.7% |
| Information Technology |
0.6% |
4.4% |
19.7% |
Source: iShares.com.au
Currency
Valuing a currency is one of the most difficult tasks in finance. Ultimately the strength of the Australian dollar will be determined by how much money flows into Australia. Since the depths of the Global Financial Crisis, the Australian economy has been resilient and with a strong banking system, sovereign credit rating of AAA, relatively high interest rates, and low levels of government debt suggesting good fiscal management, significant capital has flowed into Australia.
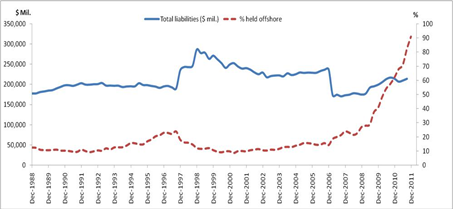
Chart 9
Source: Tyndall Investment Management & Bloomberg
As Chart 9 shows, at the end of last year around 90% of Australian Government debt was owned by offshore investors. How much higher can this go? Well it can’t get to 100% assuming locals own something, but if it flows out then it would definitely have some downward pressure on the Aussie.
Chart 10 shows the performance of the Australian dollar and whilst past price doesn’t or shouldn’t be able to predict future price, this prce path does suggest that it can be volatile and can drop rapidly in tough times when the global reserve currency, US Dollar, comes into play.
Chart 10
Source: RBA
This simple analysis suggests that there is possibly more downside risk to the Australian dollar than upside potential. As a result, for global equities my preference is hold more unhedged positions than hedged positions.
This however, is not the case for the lower volatile or income focused asset classes where the volatility of the Australian dollar can overwhelm the risks of the asset class you are trying to capture. As a result, I believe (and probably always will) that Global Property (Infrastructure) and Fixed Interest asset classes should always be fully hedged to Australian dollars.
Alternatives
With equity markets expected to be volatile, fixed interest markets at record low yields and cash rates expecting to go lower, property behaving equity-like, its difficult to think of a more difficult time to invest…particularly for those who need higher returns. So the natural step for many may be to look outside of these traditional asset classes and consider alternatives.
Fundamentally there are two types of “”Alternative” investments…
- Hedge Fund Strategies
- Real Assets
Hedge fund strategies are a difficult sell for the retail investor as they are not simple to understand, you never really know what risks they are accepting and therefore lack transparency, and most frustratingly, they are typically very expensive…contrary to popular belief the 2 and 20 still exists.
That leaves Real Assets. These may come in the form of direct investment in Infrastructure, Direct Property or Commodities. Infrastructure and Direct Property differs from their listed cousins simply from a liquidity perspective whereby additional returns may be gained by giving up the liquidity that a sharemarket provides.
In general with the world currently deleveraging, illiquid assets are historically cheap as low risk and highly liquid assets (like US Treasuries) are in high demand. Because the current situation is expected to be around for many years, this means buying illiquidity must be a long term strategy so investors must be prepared to invest for the long haul and no one really knows how long this is.
Commodities, which can be traded on a spot market or using derivative contracts such as futures or forwards, represent potential hedges to inflation or in the case of Gold, a hedge against the instability of the global financial system. As opposed to traditional asset classes, Commodities do not pay income and are really subject to simple supply and demand. Gold, once again, is a little different in terms of the supply/demand relationship as it is an element that is relatively useless for anything other than jewellery and its hedge to the global reserve currency, the US dollar.
Over recent years, commodities have performed very well thanks to the Chinese economic boom whereby the Chinese were building cities the size of Brisbane almost every month. With the slowdown underway, commodity prices have come off and whilst there is a limited supply which means owning a scarce resource makes sense, the current risks ensure this asset class continues to be volatile and potentially damaging to financial health.
Whilst the Chinese have not been buying Gold to assist with their growth, gold has been purchased in the face of US weakness over the last decade such that it is the best performing asset of all. Despite that, with the potential of a Euro collapse still around, this presents some potentially strong reasons for owning some of this financial system hedging asset.
Volatility
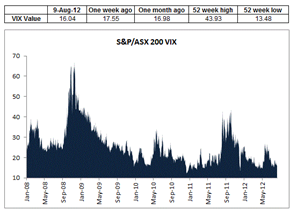
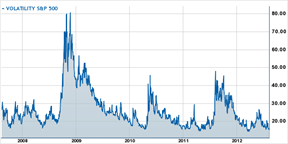
Chart 11 shows the VIX index for both the S&P/ASX200 and S&P500 over the last 5 years. The expected volatility is near their absolute lowest which given the potential downside risks thanks to the 3 largest economies of the world (US, Europe and China); volatility currently appears relatively cheap. What this means in an investment perspective is that buying volatility may be better value than selling volatility so buying options may be a reasonable way of entering a position to support a view. There are hedge fund strategies that buy or sell volatility and now appears to be a buying opportunity.
Chart 11 – VIX Index of ASX200 and S&P500 respectively
Putting it all together
Whilst the above comments include opinions of high volatility, low yields, low return potential and probably some questionable or weak arguments; it is very very difficult to time markets or even pick the direction of markets. As a result, we must rely on the only free lunch in investing which is diversification.
Whilst I do believe investors would be wise to be underweight equities, its not because of its return potential (which is actually quite high should consumer confidence return) but because of its high volatility expectation; therefore holding equities is still important as should be bonds, cash, maybe listed property (although it should be part of a diversified equities portfolio) and even commodities.
How it is all put together depends on one’s propensity accept risk combined with return needs. If a high return is required (e.g. 10%pa) then there is little option but to hold equities or at least some non-investment grade credit. However, if one’s needs are only for capital preservation and a return goal of around 5% then there is little need to accept any more risk than the currently well-priced term deposits offered by many Australian financial institutions. Obviously if in between then a combination of multiple asset classes is appropriate.


