Following are my recent thoughts around markets with many charts to support these views. These views are far from complete but do represent a reasonable summary at this point in time.
Income Assets
Source: RBA, Delta Research & Advisory
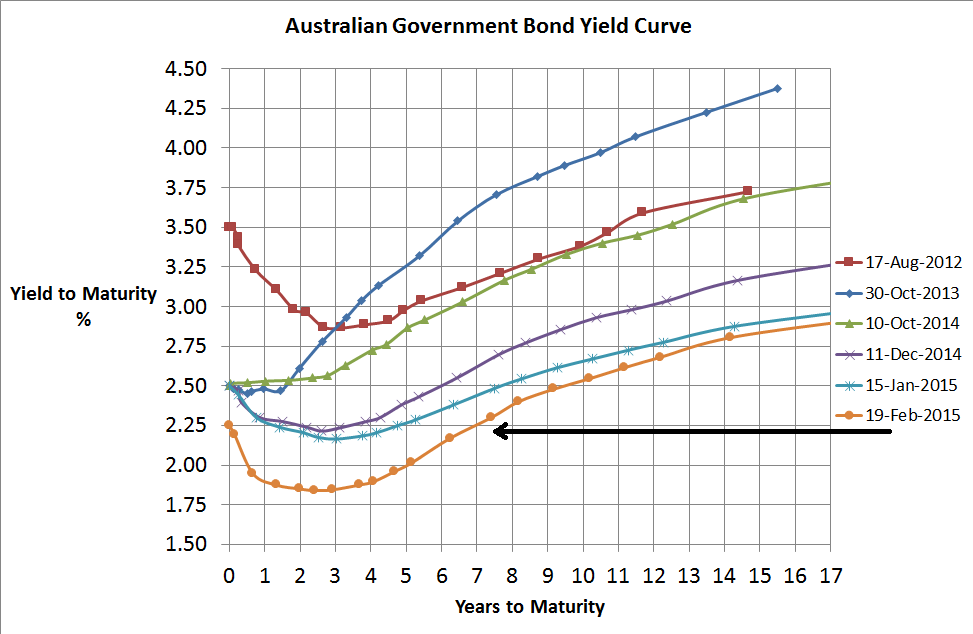
- The above left chart suggests the market believes the cash rate is heading towards 1.5% to 1.75% and there is likely to be continued weakening of the Australian economy
- With cash rates currently at 2.25%, cash does appear to be slightly better value than conservative bonds where the yield is less than 2% around 4 to 5 year terms.
Source: RBA
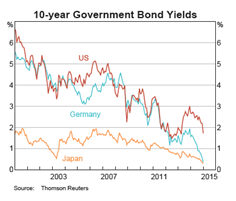
- Major global bond yields continue to trade near record lows with little sign of inflation or rising interest rates anywhere
- Despite that, there is talk of an increasing cash rate in the US and too much too soon is likely to put significant strain on the US economy and therefore equity market also.
Source: RBA
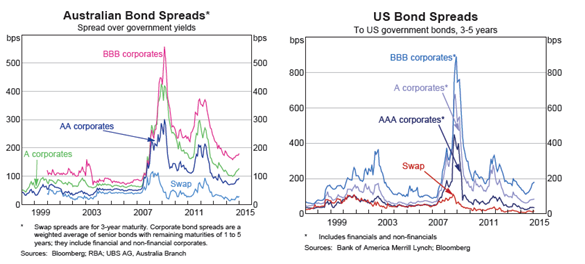
- With BBB spreads only around 180 basis points above government bonds, then the expected return of the Australian Fixed interest market (~UBS Composite) over the next 3 to 5 years is only around 3%pa.
- These spreads do represent slight value as traditional default rates are below these spreads suggesting a higher risk-adjusted return can be had if Australian credit is held for the long term
- US Credit spreads appear to be at similar values to Australian credit also suggesting similar value.
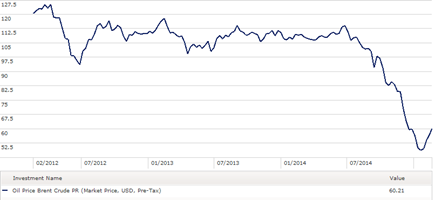
- However, a significant number of high yield corporates are energy companies and the collapse in oil prices (see below) do make the high yield sector somewhat riskier than usual
Source: Morningstar Direct
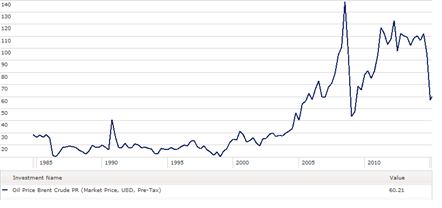
- Oil’s recent price collapse is the second biggest over the last 30 years
Source: Morningstar Direct
- Prefer Cash over Australian Bonds over Global Bonds but investment grade credit also has marginal appeal.
- So overall preferred strategy is short duration, investment grade credit
Equities
- As suggested above, Australian and major global economies continue to appear weak or fragile at best.
- Forecast earning for Australian companies for 2015 and 2016 years have been in decline
- Despite economic weakness everywhere, Australian sharemarket appears to be significantly better priced than global shares on a PE ratio basis by the biggest margin for over 10-12 years
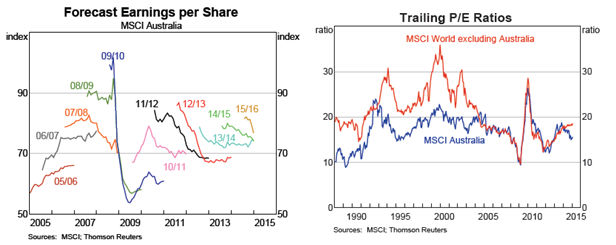
Source: RBA
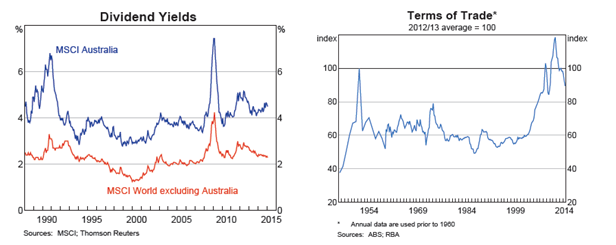
- Supporting the lower valuation is also a superior dividend yield from Australian companies and when you add the “only available in Australia” franking credits, the simple view suggests much better value for Australian equities
Source: RBA
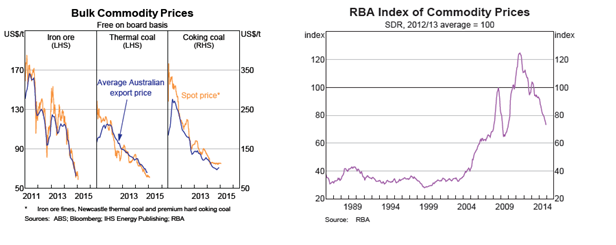
- However the key risk to the Australian market is the rapidly declining terms of trade lead by the decline of key export commodity prices which will flow into most aspects of the Australian economy.
Source: RBA
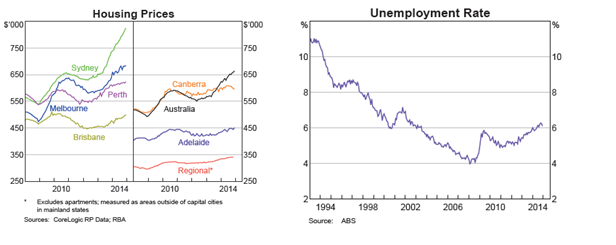
- Other threats to the Australian market include a collapse in residential house prices which are at record highs in most cities, although are at threat should unemployment spike higher
Source: RBA
- Whilst Australian equities appear better value than global equities, Emerging Markets appear even better again with a PE Ratio significantly below global equities (13.4 vs 17.9). Other valuation metrics for Emerging Markets are also quite favourable including forward PE ratios, and price to book value.
Source: www.msci.com
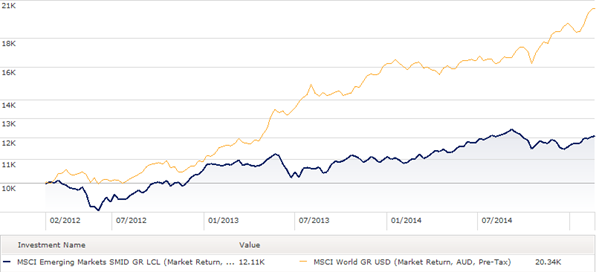
- Emerging Markets equities have also performed quite poorly in recent years thanks to the slowdown in China which, like Australia, has been a dominant economic force.
- The risks for investing in Emerging markets is the instability of their currencies which have been incredibly volatile over the last couple of years (since there was an original hint of the unwinding ofQE3).
Source: Morningstar Direct
Property & Infrastructure
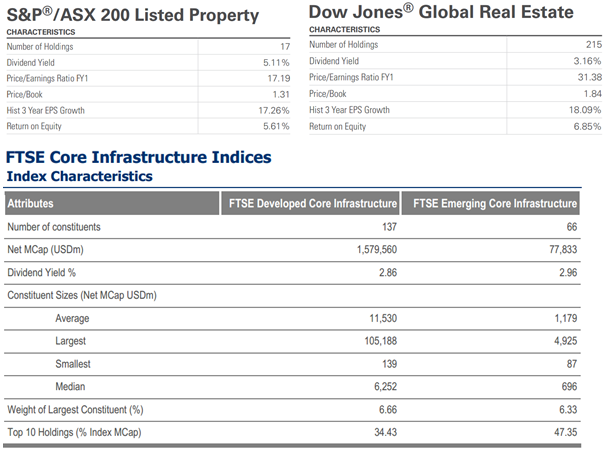
Sources: www.spdr.com.au , www.ftse.com
- Australian property paying higher dividend yield by around 2% which is also around the carry received from hedging global property into Australian dollars
- Price to Book value and forward PE suggests Australian property may be better value although return on equity has been lower which is most likely a reflection of the lower gearing levels in Australia
- Greater diversification or less concentration in the Global Property market compared to the Australian market which is dominated by a few securities such as Westfield
- The table below shows a current dividend yield of only 2.9% for developed infrastructure which is slightly lower than global property and a reflection of its recent strong performance
- Value in all three sub-asset classes has diminished significantly
- Current trend of chase for yield may assist these asset classes in a low interest rate environment but their value appears weak
Equity Styles
Value vs Growth
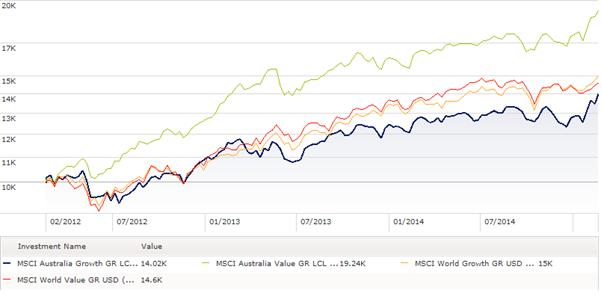
Source: Morningstar Direct
- Significantly stronger performance by Australian value over Australian growth during last 3 years…belief in mean reversion suggests a bias towards growth strategies
- Very little difference between value and growth among global equities so preference remains value
Small vs Large
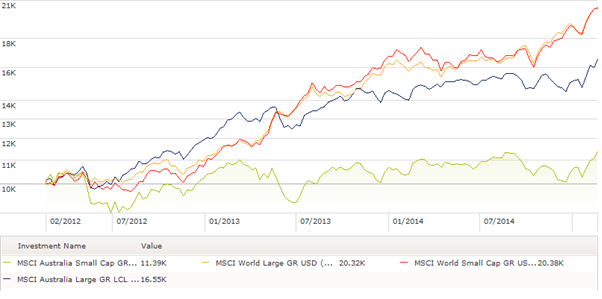
Source: Morningstar Direct
- Similarly Australian smaller companies have significantly underperformed larger companies
- Very little difference between large and small among global equities so given the high valuations a preference is to keep the typically more volatile small companies to a minimum


