Nov 08

Merton’s Retirement Income Views…correct but its not a product solution…its an advice solution!!!

Nobel laureate economist Robert Merton says David Murray’s Financial System Inquiry must fundamentally shift how Australia thinks about superannuation. He says the desire to maximise lump-sum balances at retirement is excessively risky; the focus should be on ensuring retirement income is enough to meet a desired standing of living.

Source: AFR – 6 Nov 2014 (Paywalled)

I completely agree with this paragraph…in fact, I would say its worse than that as my recent personal experience working with advisers suggests there is still a strong culture of short termism with the focus on maximising returns today as opposed to between now and retirement. However, despite my agreement with the problem, the solution is definitely not a product or super fund, as alluded to by Merton…

…too many super funds are failing to de-risk balances as employees approach retirement, exposing them to market volatility which could slash their retirement incomes.

…But given this Nobel Prize winning Economist is currently consulting to a product provider then this view is not surprising.

The only solution to this retirement income problem comes from high quality, ongoing, personalised, financial planning. A product can never be personalised and efficiently consider their investor’s needs because they are all different. Investors have different net assets, different savings abilities, different lifestyle costs, and different risk tolerances, so any product solution looking to optimise these issues across a cohort of thousands is kidding themselves…but there is still opportunity for improvement so good luck to Merton and his clients.

So if providing high quality personalised financial planning can make a difference, why aren’t they doing so? I think the opening paragraph still gives the primary clue in that the financial planning focus in accumulation is not focused on providing an adequate retirement income to meet a desired standard of living.

A desired standard of living can be calculated from a budget….its not hard but its rarely done. Taking the time to estimate a household budget can identify savings opportunities, insurance needs, and those non-discretionary expenses that are likely to endure into retirement…its a very powerful exercise which is too often left out of the financial planning process because its importance is underestimated. A superannuation fund is unlikely to ever collect this detailed information…if it did, the financial planning industry would be in deeper trouble than it is now as not enough financial planners collect it now.

So the budget will provide an indicative retirement income, throw in a few estimates of other likely costs in retirement and you have a reasonable estimate of the desired retirement income…providing for this should be the primary goal. This income estimate leads to the magical figure to provide financial security…or for some, financial independence.

To calculate what we need to provide this retirement income we simply look up lifetime inflation linked annuity rates. Currently a couple of around age 65 will get inflation linked income at around 4%…so to provide an inflation linked income of ~$60,000pa requires around $1.5million in today’s dollars. This is an example of the capital goal at retirement BUT it is in today’s dollars, so moving forward it must be adjusted for inflation, plus, it is using today’s interest rates, so will also adjust as interest rates go up and down…which therefore results in moving annuity rates. Finally, the desired lifestyle spend may change so this needs to stay updated also as part of the financial planning process.

Now, I know many investors and financial advisers will object to my use of inflation linked lifetime annuities from a life company because there is a belief that they offer returns that are poor and they can do better. I’ll be succinct…noone can do better without taking on some risk…therefore there is a risk of failure if you choose to ignore the inflation linked lifetime annuity rates so you probably need to increase the capital goal in today’s dollars above that of the annuitised value…just in case….happy to argue this point another time. Please note, I’m not saying inflation linked lifetime annuity rates are good…they’re just one of the closest investments we have representing the risk free inflation-linked rate for retirement…so by definition as a risk free rate approximation of course the returns should be low.

Finally, using a client’s net assets, and a conservative estimate for future net savings, the financial planner can calculate the desired real return for achieving the desired capital goal…this desired real return should then dictate the strategy or asset allocation of the investment portfolio and must adjust regularly based on changing goals, savings, and investment performance…much easier said than done…but definitely doable. The final point to the recommended strategy is that the desired real return must consider risk tolerance levels…and if the return goal is too high for tolerance levels…then so too may be the retirement income goals, so adjustments are a must.

What this all adds up to is a process that is personalised, objectives based, and adjusts according to client needs, circumstances, goals, market conditions, and clearly requires an ongoing advice relationship. In comparison, a product solution will always be sub-optimal and always reliant upon strong markets. This path dependency (i.e. market performance reliance) is why life-cycle solutions will never replace good financial planning and whilst they may be good solutions at a cohort level, will always be a poor solution for an individual.

   Send article as PDF   

Oct 11

Australian Bonds and Equities…who would’ve thought?

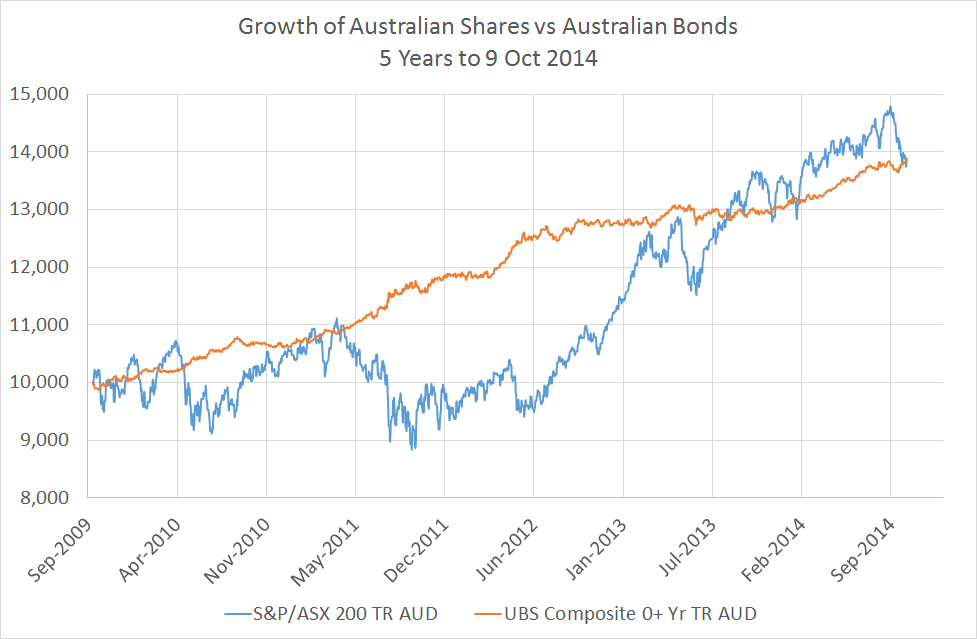
Aust Shares vs Aust Bonds - Last 5 Years

Source: Morningstar Direct, Delta Research & Advisory

Over the last 5 years their performance has been pretty much the same…with the obvious exception that equities has bee a much much wilder ride. The reality of bonds in this global economy is that the outlook is still not that great from the major players (US, Japan, Europe, and in a sense, China) and so there has been and probably will continue to be, at least in the short term, a low interest rate environment. I say, in a sense china, because their rate of economic growth is slowing and that is clearly having a negative effect on the Australian economy.

Moving forward, whilst I do believe equities is a better place for higher returns than bonds, I’m not expecting the disastrous returns for bonds that so many commentators are talking about. The Australian economy is transitioning away from a resources-led economic boom and at this stage, there is still nothing there to replace it. Economic growth forecasts aren’t that high and neither should they be. Apart from what I’ve already mentioned, the government appears hardly likely to hand the economy any additional fiscal support and it all adds up to lower levels of average earnings growth too. There are a few other factors I won’t dwell on, but expectations over the next few years should be continued low inflation, low interest rates, low sharemarket returns, and a tough time for the baby boomers as they add fuel to the fire by selling their expensive properties to maintain their retirement lifestyle…so lower residential property returns too.

The one major variable that could change it all is the Aussie dollar. Its currently around $0.88USD and if that continues towards a sustained $0.80USD or below, then the attraction for Australian investment and spending will go beyond the current attraction of higher interest rates and towards industries such as manufacturing, tourism, and our services (e.g. education). But until that happens the investment landscape is bound to be tough…unemployment will continue to increase, our wages will still be globally high, and the spending will continue to be low by recent historic standards.

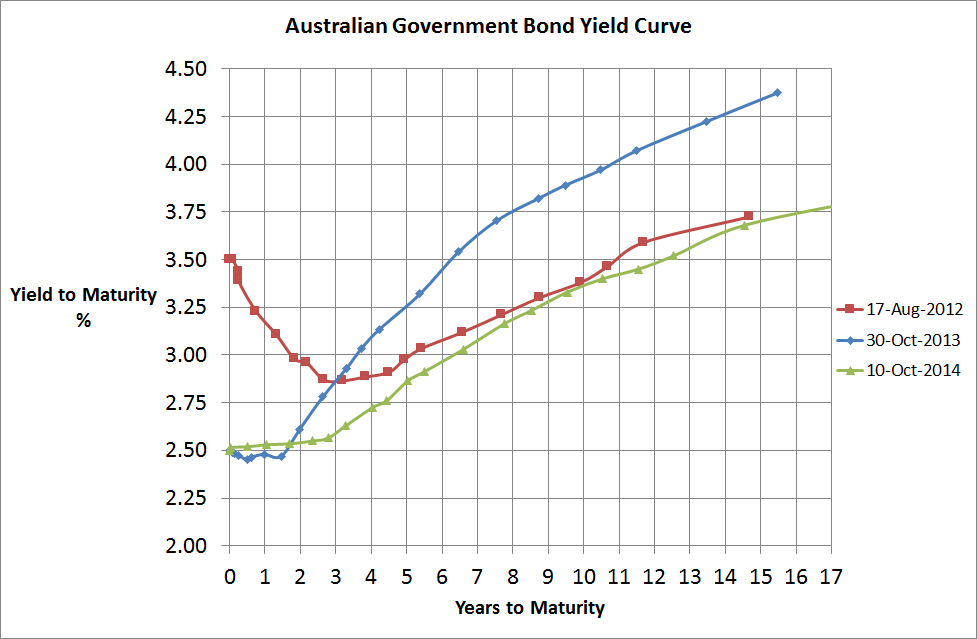
Whilst I don’t believe we’re necessarily heading for any disastrous recession, far from it, I simply believe our complacent view of the Australian economy and expected market returns require an adjustment downwards. And, if you don’t believe me…perhaps you’ll agree with the bond market (see chart below) with government yields suggesting longer term growth expectations are lower than last year and the year before.

Aust Government Bond Yield Curve - 11 Oct 2014

Source: Delta Research & Advisory


   Send article as PDF   

Oct 07

SPIVA Report…strong evidence supporting active management in small caps…not much else

My favourite simple performance report on active management came out today on the Australian market…it can be downloaded by clicking here. Unfortunately active management for the broad asset classes once again came up looking poor with an overwhelming proportion failing to outperform broad indices for Australian Shares, International Shares, Australian REITs, and Australian Bonds. An enormous proportion of active managers were successful in outperforming their Small Cap Australian shares benchmark thus providing some support for the widely held belief that markets are a little less efficient in small cap land.

Anyway, if you don’t want to download the report the result I’m talking to just look at Table 1 below….

Table 1 – Percentage of Funds Outperformed by the Index

SPIVA Australia Results - June 2014Source: SPIVA Australia Scorecard – Mid June 2014

This report is one of my favourites because it takes survivorship bias into consideration…it does this by only surveying funds that were around at the start of the survey period, as opposed to those at the end of the period (which obviously leaves only the good ones). Its also worth pointing out that this is a survey of retail unit trusts so they clearly come with higher fees but lets face it, access to wholesale funds for almost everyone still has platform fees on top.

Of course retail index managers still may cost up to 90bps in these various categories (which is quite appalling in my humble opinion) and they are guaranteed to underperform so its not necessarily as compelling a case for index funds as it appears…but those 3 and 5 year numbers are pretty bad (except for small cap).


   Send article as PDF   

Sep 27

Bill Gross leaves PIMCO…might lead to a downgrade or two

Irrespective of the quality of the rest of the firm, and there is a lot of quality, with the departure of Mohammed El Erian at the start of the year and now Bill Gross, it doesn’t take much to guess there may be a little destabilisation at the PIMCO offices for a while. Whilst Bill was the manager of the world’s biggest fund, the $220billion+ Total Return Strategy, he is also the manager of the PIMCO Global Bond fund which is one of the more popular global bond funds in the Australian market…so things could get interesting locally too.

When purchasing a managed fund, as much as the funds try and sell you on their process and systems, the final investment decision rests with the chief portfolio manager and when he or she leaves, so will their performance…that’s not to say performance will be bad, but it will be different as each manager has their own style. Therefore the return behaviour of the PIMCO Global Bond fund will differ when the new manager, most likely the very competent Scott Mather, brings his new style to the table. Throw in the fact that Bill’s departure will destabilise the business somewhat, I’m pretty confident we will see a raft of HOLD, FUND WATCH ratings, and given the high institutional following maybe even some SELL ratings.

Why a SELL rating? There is every chance the outflows from the funds that Bill Gross managed will be enormous as it is likely many large institutions will show their loyalty to Bill and take their funds to his new home at Janus ro simply elsewhere. So this massive outflow may put some downward pressure on their funds that could be forced sellers…so from an investor’s perspective…it may be better to get out now than be locked up for an indefinite period. I hope I’m wrong, but I can’t really think of the last time a manager of a world’s largest fund quit and moved to another company so to be honest…I don’t really know.

No matter what happens this departure will provide somewhat of a prelude as to what may happen when the world’s greatest investor, Warren Buffett, is no longer at the helm of Berkshire Hathaway. Whilst Warren is the world’s greatest investor, please keep in mind that in the world of bonds there is no bigger name than Bill Gross.


   Send article as PDF   

Aug 22

Low Beta Anomaly…mispricing or risk?…(a little technical)

At the Portfolio Construction Conference 2014 I had the good fortune of being on stage to discuss Ryan Taliaferro’s presentation on the Low Beta Anomaly. Now I know I’ve opened up with a lot of jargon, so in plain english…the low beta anomaly  more or less says, shares that exhibit low levels of price volatility, on average, outperform shares with high volatility. Its an anomaly because if we accept volatility as a proxy for risk (which we have done for decades), then you would expect highly volatile stocks to outperform, not the other way around, because investment theory says to get high returns requires high risk.

One of the presentation’s conclusions was that this anomaly is a mispricing and is likely to persist because fund managers are inclined to hug benchmarks and avoid the tracking error (that is, significant deviations from benchmark returns) from low volatility stocks, therefore highly volatile stocks are overpriced due to over-attention. The variability in most portfolios are primarily driven by the variability in the most volatile investments so it is plausible that avoiding highly volatile stocks could be perceived of increasing a fund manager’s chances of underperformance which obviously increase their chance of unemployment.

A second conclusion was that the anomaly cannot be explained as a risk…which I have to admit  is not easy to wrap your head around…but…this is where I have a slight disagreement. I say slight because whilst I do believe low volatility stocks carry a risk that does not exist in high volatility stocks, I don’t believe this risk explains all of the outperformance and is more of a contributing factor.

So here goes my explanation…

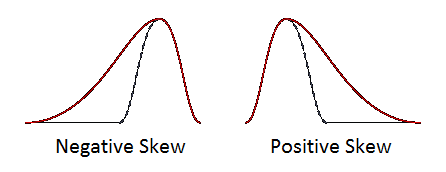
It is acknowledged that high volatility stocks have somewhat of a lottery preference amongst investors…in other words they are attractive because they have the most potential for that big win…lets face it, you have a better chance of tripling your money (or better) with a highly volatile stock than a low volatile stock. In fact, return analysis shows that highly volatile stocks have a positive skew which is a defining characteristic of lottery preference. On the flipside, the broader sharemarket and low volatile stocks have a negative skew…and investors do not desire a negative skew of returns. So increased likelihood of negative skewness is a “risk” and therefore should be compensated…hence compensation for negative skewness may be a contributing factor towards explaining the outperformance of low volatility stock compared to high volatility stocks.

Skew


Whilst buying a lottery ticket is an example of purchasing positive skewness (albeit also an irrational chance of a big return) lets not completely dismiss this phenomenon as an insane purchase as there are many positive skew purchases everyone makes that have an expected negative return…and it can be summed up in one word…insurance. Whether it be car insurance, life insurance, or any other, the expected return in the long run is negative but we still pay for it. In financial markets, the purchase of a put option (which may be an insurance contract on a poor performing market) is very expensive and is typically priced in favour of the seller and not the buyer…why?…because of the cost of positive skewness that the put option (or insurance) can bring to your investment portfolio (or circumstances). Positive skewness is a cost and that cost is applied to high volatile stocks and therefore contributes to their lower returns.

So whilst I don’t dispute the key empirical results…that low volatility stocks outperform highly volatile stocks (and this is common across many markets)…there is a deeper message to this discussion. It is, whilst volatility is a good measure of risk (and probably the best measure we have, particularly for liquid assets), it does not explain all of an asset’s risk. The stock market is not normally distributed and its volatility only tells part of the story. In fact, this is a significant factor to why the world got in trouble from the financial engineers that mispriced CDOs which ultimately led to the collapse of Lehman Brothers and others. The stock market is negatively skewed…that is not desirable; plus the stock market has many large positive and negative returns (which relates to the volatility of volatility and is called kurtosis)…that is also not desirable. The key message is that these higher moments, skewness and kurtosis, should be ignored at your peril when considering investment risk.

   Send article as PDF   

Aug 07

The disappearing credit spread…US now at pre-GFC levels

US Bond Spreads - August 2014

Source: RBA

I know this probably an overly simplistic way of looking at investment grade credit markets…but…the above chart is currently showing that US investment Grade credit spreads have declined to be in the ballpark of pre-GFC levels. Personally, the US economy is still relatively weak, albeit getting stronger, but I no longer believe this type of credit risk appears as good value and today I would rather own safer US Treasuries than US Corporate debt…why…greater protection alongside of riskier assets such as equities, therefore as far as I’m concerned Treasuries have a better risk-adjusted expected return.

According to Moody’s the worst default rate of BBB rated securities over the last 30 years was a little over 1% which occurred in 2002. The current spread provides a little more than that so there is only a little compensation for other risks such as illiquidity if things go tech-crash pear shape.

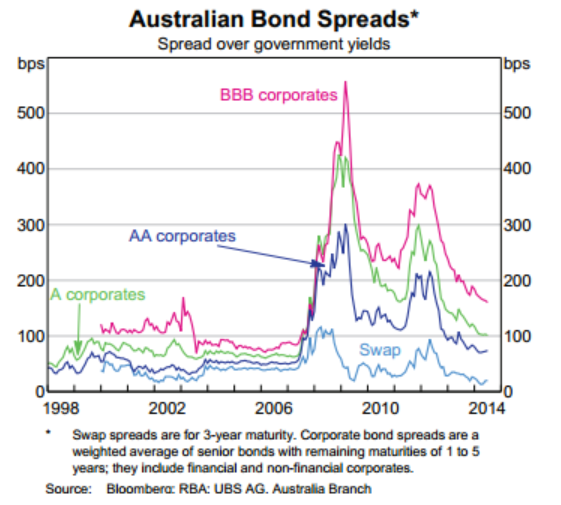
Anyway, no matter how you look at it the chase for yield from lower rated credit risk is definitely approaching its end and whilst Australian credit looks a little better or wider (see below chart), our unemployment rate didn’t increase to 6.4% for nothing…that is, our investment grade debt should have a wider spread as our economy is looking like doing nothing more in the next couple of years but weakening.

Aust Bond Spreads - August 2014

Source: RBA

   Send article as PDF   

Aug 01

Ramblings about Unconstrained Debt Funds and Portfolio Construction…wonkish and a work in progress

I’ve just returned from a manager research trip in the UK where we visited a variety of strategies from a variety of managers and fortunately for me, with some of the leading thinkers and researchers in the advice industry (hat tip D&G … and I don’t mean Dolce and Gabbana). Several of the managers we visited spoke to their “unconstrained debt” strategies and amongst the research group it was largely agreed that these are flavour of the month, but there was differing opinion about their use in investment portfolios within the advice industry.

Definition

Firstly I think it’s appropriate to define what an unconstrained bond fund is. The key is obviously in the definition of unconstrained…typically, the fund is managed to an absolute return-like objective (e.g. Cash + 3% over rolling 3 years) and therefore independent of traditional bond benchmarks like Barclays Global Aggregate. As a result there is the ability to execute virtually any debt-like strategy or instrument whether it be long or short duration, credit/high yield, government, CDOs, ABS, swaps, etc…hence unconstrained. These basic characteristics don’t suggest they are accepting significant risk, particularly given there is often a secondary objective that is more like a Sharpe ratio (which may be excess return over cash divided by volatility)…so it’s more of a risk-adjusted benchmark which should make the punters happy with respect to risk-based objectives. There may be other characteristics and sometimes certain constraints that are common sense with respect to objectives (e.g. minimum liquidity) but in my opinion these are the core characteristics with the bottom line that managers of these strategies have numerous levers to pull to gain and protect depending on their view of the investment world.

Flavour of the month?

There are several factors that suggest these funds are likely to be very popular amongst investors today with the main ones being…

  • Potential for gain in rising interest rate market…It appears current market consensus is that interest rates around the world can’t stay near these historic lows and therefore can only go one way…up…this means the return expectations for traditional conservative bond funds are very low and investors are looking for an alternative.
  • Flexibility to avoid being caught in another credit crunch…Credit spreads have been tightening since the start of 2009 and the downside risk is also increasing so exposure to a strategy nimble enough to know when to get out of high yield can be quite handy…let’s face it, high yield bond funds had equity-like negative returns during the GFC and no one wants to experience that again so why not give a manager the chance to exercise their discretion?…well, perhaps there’s a few reasons but I digress.
  • Many believe bond benchmarks are flawed and should not be managed to… Rightly or wrongly there is a wide-held belief that debt benchmarks are poorly constructed as they have the highest weights to the most indebted companies and/or governments so benchmark risks are high…managing to an absolute return outcome that is independent of debt benchmarks may be attractive.

Given these unconstrained strategies are not “beta” or market-related strategies, they are very much pure “alpha” strategies and heavily reliant upon the pure security selection and/or market timing skill of the portfolio manager. Their performance has been short term and experienced a tightening of credit spreads combined with declining interest rates so irrespective of the portfolio position many bond funds have a reasonable track record if set up post GFC…and that appears to be the case. This relates to one of the major risks of these unconstrained bond funds and why it may be risky to fall in love with these strategies…they are yet to be truly stress tested by the markets.

Portfolio Construction

In terms of portfolio construction there was a lot of debate around where these funds should be allocated in a portfolio. The agreed options were quite obvious…either the debt (or bond/fixed income) or alternatives allocation.

The debt allocation centred on the fact that the returns come from that particular asset class, whilst the argument for alternatives is pretty much centred on the strategy’s complexity and its non-benchmark investment approach.

My personal belief is that they should sit in the Alternatives allocation but either way, current portfolio construction methodology in advice world is led by the asset allocation decision which is primarily a “beta” (or market-related) decision and these funds with their non-benchmark objectives have the potential of ruining the intentions of any recommended asset allocation. If the beta decision of the asset allocation is less of an issue than the allocation of unconstrained debt strategies is possibly a question of investment philosophy and how these funds are likely to satisfy associated investment beliefs…in other words… irrespective of strategy, a key question to answer is “what is the role of the debt investment in the broader portfolio?”…it is a diversifier to reduce portfolio risk, is it a pure income focus irrespective of correlations with other asset classes, or some combination?

Debt Investment Philosophy

Traditionally, the debt asset class has a defensive role and equities the aggressive/return driving role. The unconstrained debt portfolio may significantly vary between traditional defensive and aggressive assets over time and the return success is therefore highly reliant upon the market timing skills and security selection skills of the manager…which is a risk in itself. This paradox is the first major challenge to assigning unconstrained debt funds to the debt allocation…that is, it potentially compromises the defensive role.

AS already mentioned, there is a widely held belief that interest rates around the world are more likely to increase than decrease in the coming years, and accompanying this is the belief that holding conservative bonds is the risky position. Therefore unconstrained debt strategies may actually reduce risk given an assumed improved return expectation in a rising interest rate market. Unfortunately there is one significant problem with this belief as is it is purely a return driven one and ignores broader portfolio risk. In other words, there is little or no consideration of the correlation with the other asset classes, and we should expect higher correlation to equities will increase portfolio risk significantly more than high correlation to bond indices. Certainly the possibility of low correlation in poor performing equity markets exists, but it requires the unconstrained bond manager to have that position as opposed to being a natural hedge like conservative bonds often are in times of stress.

The GFC was a wonderful exercise in understanding what true diversification was as certain debt investments (i.e. higher yielding) turned out to be highly correlated with equity markets and declined in value at the same time providing little to no diversification whatsoever.

Portfolio Construction Flaw

As mentioned, the current investment approach in retail advice is a two-step process. The first step is to assign an asset allocation based on an investor’s outcome needs and risk tolerances. The second step is to assign investments to the various asset allocations. Model portfolios aside, the flaw in this process in advice world is that these two steps are separate and the asset allocation decision, which is a beta or market-related decision, is often ruined by the investment allocations and using unconstrained debt funds is a case in point unless the asset allocation decision specifically provides for this type of strategy (and if it does then there is bound to be some arbitrary quality to the allocation as opposed to an objective return and risk focus).

For example, if the Strategic or Dynamic or Tactical asset allocation suggests a 30% allocation to debt strategies and the benchmarks for this allocation is the UBS Composite (in the case of Australian debt) and Barclays Global Aggregate (for Global debt), then allocating an Unconstrained debt fund will potentially reduce the required exposure to these asset classes…certainly the strategies we looked at had little to no correlation to these indices hence changing the asset allocation. This is the main reason why allocating to the debt asset class more often than not is inappropriate.

Alternatives Allocation

So what we are left with is the allocation of unconstrained debt strategies to the Alternatives asset class. However, this still creates some problems and the first problem relates to the definition and objective of Alternatives.

For most investors the alternatives asset class is the non-traditional asset class. It comprises anything that has little to no relationship with traditional debt and equity investments. It therefore comprises assets such as hard and soft commodities, illiquid assets like private equity, direct property and direct infrastructure, and complex hedge fund strategies like global macro, arbitrage, short selling, managed futures, and exotic derivatives like structured products. Given their complexity and perceived lack of relationship over time with traditional markets, unconstrained debt strategies appear to sit neatly amongst the complexity of hedge fund strategies.

However, an arbitrary allocation to the Alternatives should never occur…arbitrary allocation will obviously increase unnecessary risks as it is possible to create both a low risk alternatives portfolio and a high risk alternatives portfolio so constructing according to objectives is a must.

The design of the Alternatives portfolio is part of the broader portfolio so should have careful consideration of potential correlations with not just the remaining alternative investments but traditional asset classes too and particularly in times of stress.  Secondly, how will the unconstrained debt strategy likely contribute to the desired return and risk of the alternatives and overall portfolios?

Correcting the Portfolio Construction Flaw

The approach of considering an individual investment at the same time as the broader portfolio’s return and risk objectives should not just occur within the Alternatives Asset Class but at the overall portfolio level as well. Separating the beta decision from the alpha decision is an inefficient approach to portfolio construction and the decisions should be made together with portfolios return and risk objectives top of mind at all times.

This approach removes the two step approach to investing that the advice industry has embraced moving towards an integrated asset class and investment selection approach. The asset class allocation then becomes the output instead of the input.

Of course, all of this is perhaps easier said than done and it may produce other risks unstated and perhaps require tools or skills that are not available…but an integrated asset class and investment approach should increase the alignment with return and risk objectives instead of the current approach in which the investment decision often ruins the recommended asset allocation.

   Send article as PDF   

Jun 14

Market Cap Weighted Bond Indices…always tough to beat

The common criticism of market-cap weighted bond indices is that they are inefficient because they are obviously weighted towards those with the most debt. Thus indicating that the index potentially carries more risk than necessary, or than we may want in a portfolio, because those with the most debt carry greater default risk than those with very little debt.

Whilst there is definitely logic to this argument it is missing one essential ingredient…price. If those with the most debt are priced appropriately such that the price reflects all risks associated then any argument of inefficiency is irrelevent.

On the other hand, if there is mispricing it doesn’t mean a bond index fund is a bad place for investment or easily outperformed. Generally speaking, aside from lower fees, if the mispricing favours an overweight to the higher market cap securities then the index will be very hard to outperform given the high weighting towards the cheap assets. Active management has its best opportunity to outperform the index if the mis-pricing is such that the higher market cap securities are over-priced and given those securities are typically the most traded and therefore, in theory, most efficient then it still becomes a difficult task for the active manager to outperform the index.

As a result it is not surprising that bond managers have significant difficulty in outperforming their market cap weighted benchmarks…despite the more frequent agreement among investment professionals that bond indices are more flawed than equity indices, See SPIVA table below…

SPIVA Table Dec 2013

   Send article as PDF   

May 16

Australian Bond Yield Curve…small budget led drop

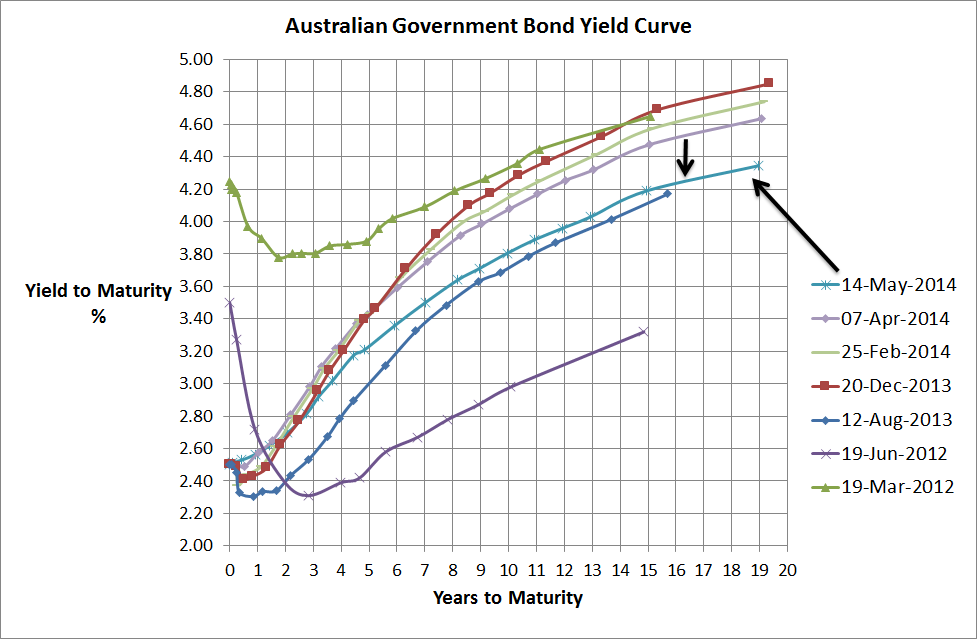
Aust Government Bond Yield Curve - 14 May 2014

Source: RBA, Delta Research & Advisory

At the e shorter end of the yield curve there hasn’t been a great deal of change. This is completely expected whilst the RBA has signaled its intention to maintain its cash rate at 2.5% for some time and, whilst not easy to tell, this yield curve suggests it will be there for the remainder of 2014. Where the yield curve is most interesting is at the longer end. This year the 10 year bond yield has dropped around 45 basis points and which actually results in a reasonable capital gain if accepting some longer term duration risk, which surprisingly, many managers did. I say surprisingly because most of the “talk” has been around keeping shorter duration positions due to longer term interest rate concerns with rates consistently near record lows.

The longer part of the yield curve is more often than not a refection of the longer term outlook for the Australian economy, which is still somewhat related to inflation expectations and therefore future RBA moves. I am guessing the incredibly negative rhetoric this year leading into the, somewhat cruel, budget may have been a large factor behind the longer term yield drop. I say that because the rhetoric has been round “tightening belts”, expense reduction, or austerity and the like. When a government cuts its expenses a hit to economic growth is a reasonable expectation. Any government initiatives aimed at economic growth will have a reasonable lag before the effects flow through and of course there’s always risks that they won’t.

Moving forward the most interesting indicator to keep an eye on will probably be consumer confidence. There’s little doubt this latest government budget is a cruel budget that in one way or another impacts everyone with the greatest relative impact on the lower income earners. If consumer confidence drops, household spending drops then businesses will respond with cuts too…increased unemployment is expected by all, but if the Australian psychology becomes too negative the RBA may revert to a dovish stance again. At this stage its too early to tell and as mentioned the market is expecting rates to stay at 2.5% for a while and its always a gutsy move to argue with the market. The current yield curve is one that suggests low rates for longer and therefore low inflation too so that’s not a bad place to be for the mortgagee but like the budget, it makes for a continued tough ride for the retired.

   Send article as PDF   

May 09

How often should we rebalance portfolios?

It appears that the financial planning industry is a big believer in rebalancing but a little unsure as to how often. Some accept the automatic quarterly option, some rebalance at the client review, some annual, or even at 13 months to potentially reduce capital gains tax by taking advantage of the 50% CGT discount.

Because the rebalance decision is often made without a second thought, planners often forget that it is in fact an active decision as to the likely frequency of tops and bottoms of the markets they are investing their clients funds into. For example, if you choose a quarterly option for your client, then in effect, its the same as believing it is likely to be a good decision to sell some equities in 3 months if they have gone up compared to other asset classes or buy some more if they underperformed. This assumption may clearly be wrong and may also have little in common with the asset allocation decision which I expect is typically designed with a longer period in mind. In other words, the asset allocation decision is a recommendation of the most efficient asset allocation for a specified time period and that time period is more likely to be multiple years than one quarter. So by rebalancing every quarter there is the risk of diluting the designed benefit of the asset allocation decision which is made with different goals in mind.

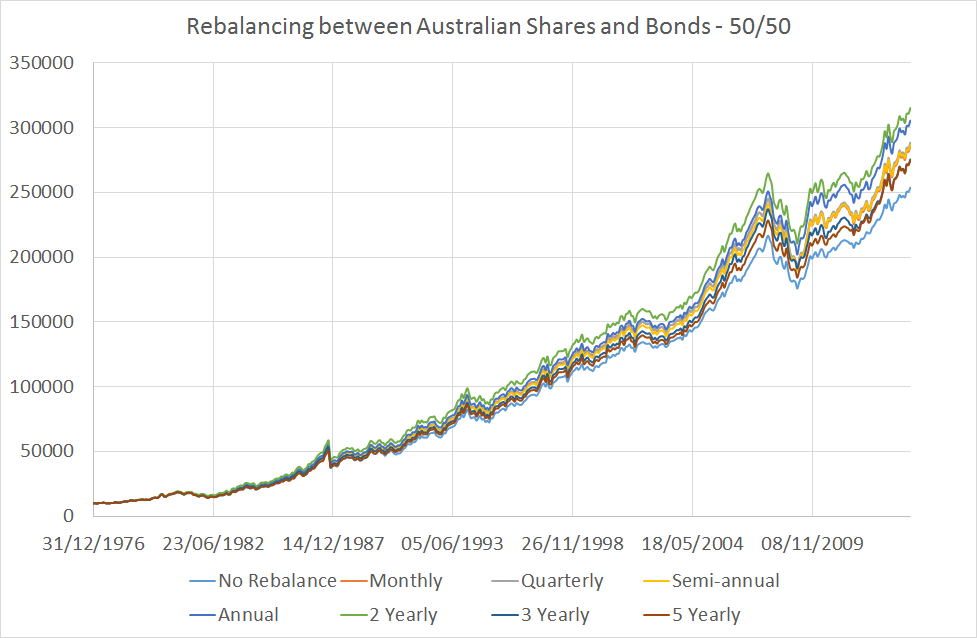
Using just Australian bonds and Australian equities I undertook a little experiment to find out which rebalance frequency may produce the better results. The experiment starts with 50% allocated to Australian Bonds and 50% to Australian equities and I rebalance at various intervals starting from Dec 1976 (that”s how far back my data goes) to see which end up with the best result. For the purposes of simplicity, I ignore tax and transactions costs (which is a very important consideration with real money) and the results are shown in Chart 1 below…

Chart 1

Rebalance Chart 1

Source: Delta Research & Advisory

Its obviously a fairly close race over almost 40 years so Chart 2 provides a close-up that more clearly shows the winner…

Chart 2

Rebalance Chart 2

Source: Delta Research & Advisory

…and the winner is the 2 yearly rebalance, with second place going to the annual rebalance and ;last place to “no rebalance”. Now its important to point out that these results are far from complete. Why? because that start date is always 31/12/1976 and the end date always 30/4/2014, and therefore when rebalancing occurs there are some dates (like yearly anniversaries) that are always rebalanced on, whilst the months of Jan, Feb, Apr, May, July, Aug, Oct, Nov never experience a rebalance. So for completion to this experiment different start dates, and rebalance months should be used. As alluded to before, the rebalance decision is a passive decision but essentially is still making a call that it is worth selling one asset and buying another at particular points in time.

Either way, these early results are interesting. A two year rebalance can provide other guaranteed and obvious benefits over monthly, quarterly, six monthly, and annual rebalancing…that is, lower tax consequences and lower transaction costs. Finally, there is no over pattern at this point in time…given the worst results are the less frequent “no rebalance” and 5 year, and the best beating the more frequent rebalancing options…perhaps its suggesting that the stronger performing equity markets are more likely to behave on a 2 year cycle…to be honest, I’m not sure yet.

The early results show 2 years may be best rebalance period but don’t take this for granted and please look out for a completed experiment in the weeks to come.

Please note, I have to admit that I got a little lazy and failed to do any literature search for others that may have written on the rebalancing subject so I hope the early results to this experiment with the latest Australian data still adds a little value to the debate.


   Send article as PDF   

Older posts «

» Newer posts

Follow

Get every new post on this blog delivered to your Inbox.

Join other followers: